


Introduction
In the world of trading, price charts tell a story. Candlestick patterns are one of the most popular tools traders use to read that story. Among them, the Doji candle pattern stands out for its simplicity yet powerful message — market indecision. Whether you trade stocks, forex, or commodities, understanding the Doji candle can help you identify possible turning points in the market.
Thank you for reading this post, don't forget to subscribe!What is a Doji Candle Pattern?
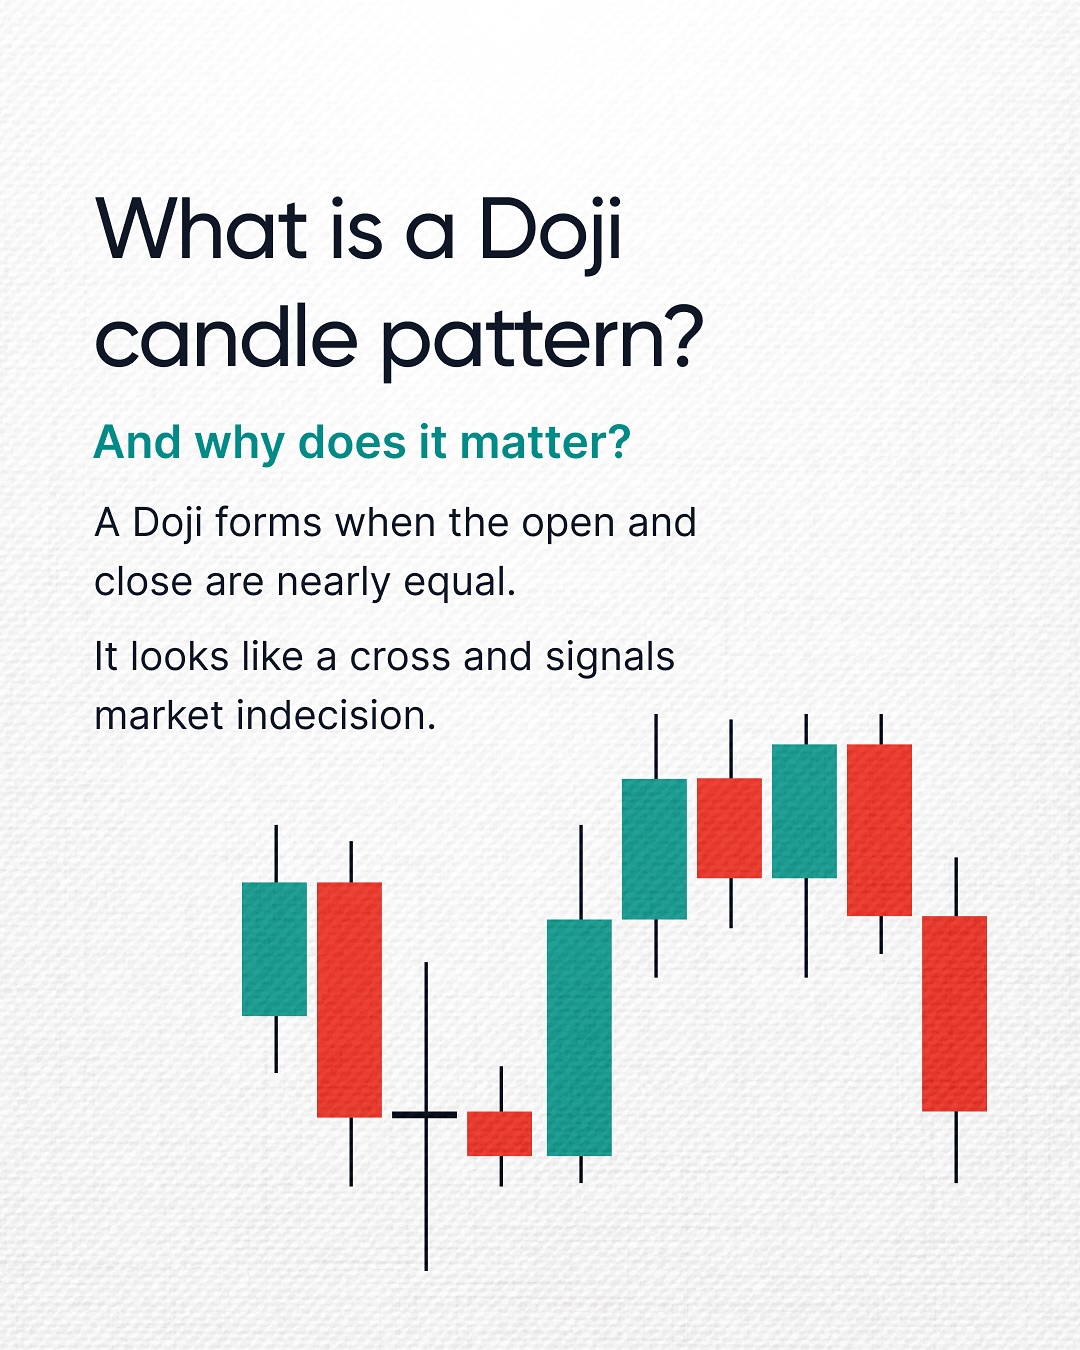
A Doji candle is a candlestick on a chart where the opening and closing prices are almost identical. This means the market moved up and down during the period but eventually settled near the same price it started.
In simple terms — buyers and sellers are in a stalemate.
On a candlestick chart, a Doji usually looks like a cross or a plus sign because the body is very small, and the shadows (wicks) can be long or short.
Why is the Doji Candle Important?
The Doji candle pattern is considered a signal of indecision in the market. Neither bulls (buyers) nor bears (sellers) have full control. This often happens when traders are waiting for important news or after a big price move when uncertainty is high.
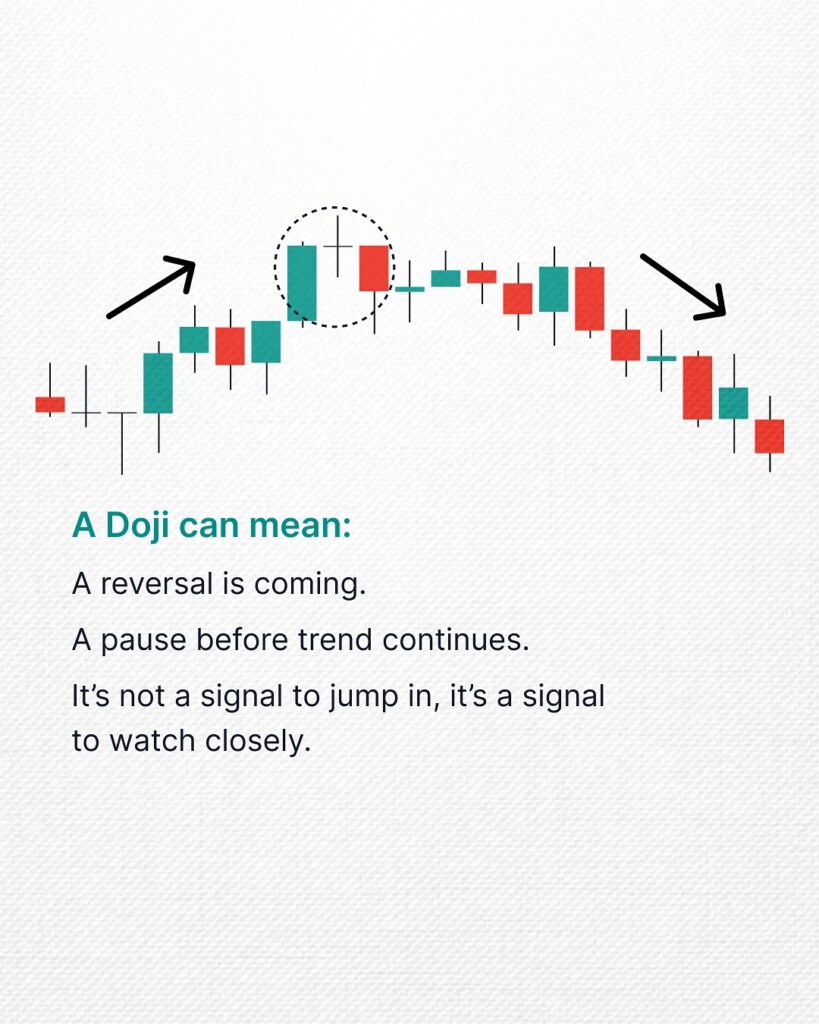
In many cases, a Doji can indicate:
- A pause in the current trend.
- A potential reversal point.
- The need for confirmation from the next candlestick.
Types of Doji Candles
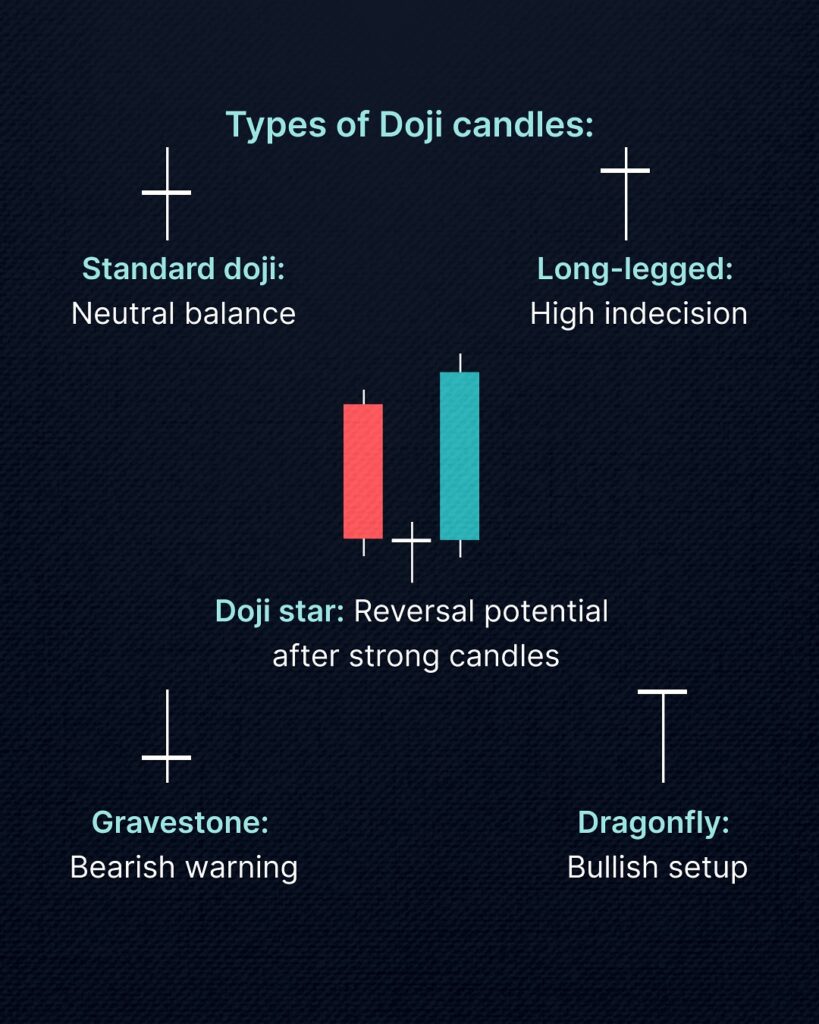
There are several variations of the Doji, each with slightly different meanings:
- Standard Doji – Small body with upper and lower wicks, showing balanced indecision.
- Dragonfly Doji – Long lower wick, no upper wick; may signal bullish reversal after a downtrend.
- Gravestone Doji – Long upper wick, no lower wick; may signal bearish reversal after an uptrend.
- Long-Legged Doji – Long wicks on both sides, indicating high volatility and indecision.
How to Trade Using the Doji Candle Pattern
A Doji alone is not a guaranteed buy or sell signal. Traders usually look for confirmation before making a move. Here’s how you can use it:
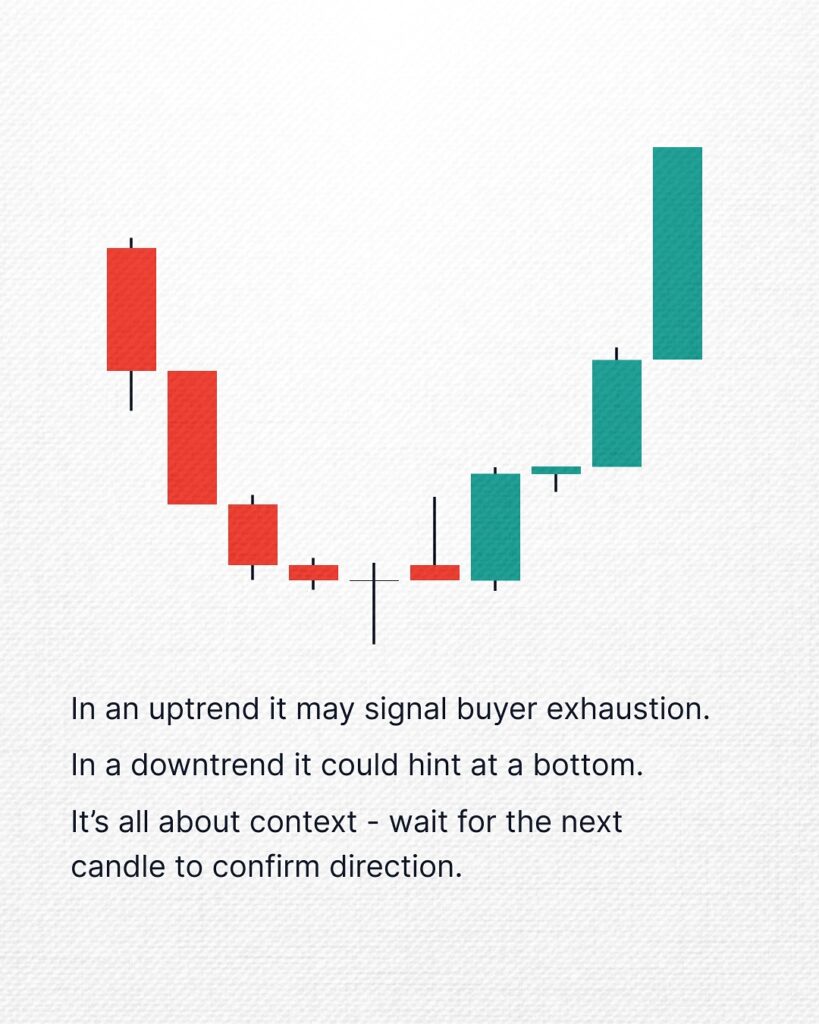
- In an Uptrend:
If a Doji appears after a strong uptrend, it may indicate the buying pressure is slowing down. If the next candle is bearish, it could signal a trend reversal. - In a Downtrend:
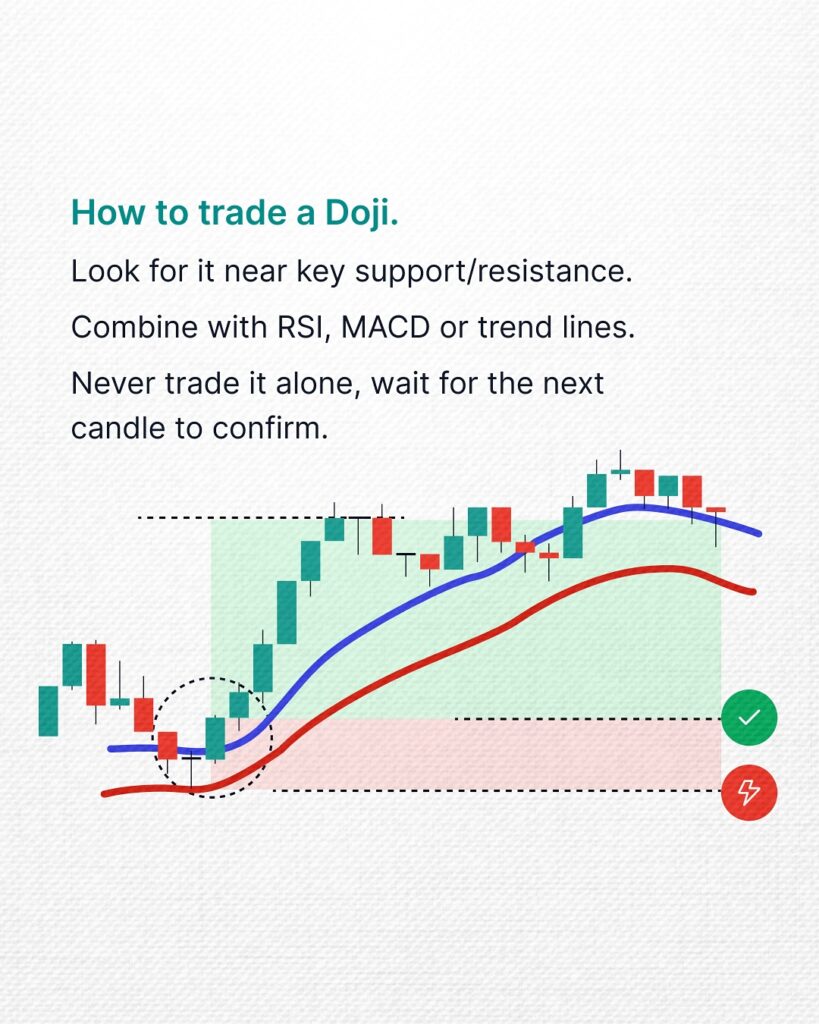
If a Doji appears after a downtrend, it might mean selling pressure is weakening. A bullish candle after the Doji could signal a reversal to the upside. - With Support/Resistance:
A Doji forming near key support or resistance levels adds weight to its potential signal.
Common Mistakes to Avoid
- Trading on the Doji alone: Always wait for confirmation from the next candle or additional indicators.
- Ignoring the trend: The meaning of a Doji changes depending on whether the market is trending or ranging.
- Forgetting risk management: Even with strong patterns, always set stop-loss orders.
Final Thoughts
The Doji candle pattern is a small but powerful signal that reveals market indecision. While it’s not a stand-alone strategy, when combined with trend analysis, support/resistance, and volume, it can help traders spot possible turning points in the market.
By learning to read this subtle sign on the chart, you can make more informed trading decisions — and stay one step ahead of the market.
![]()


